Global Matcha Market Analysis 2026: Market Size, Growth Trends, and Business Opportunities

“Matcha” now ranks alongside sushi and tempura as an international term. The global market is projected to nearly double from approximately $2.46 billion in 2025 to $4.5 billion by 2027, expanding rapidly across healthcare food and beauty applications. Japan’s export value reached a record ¥29.2 billion in 2023, bringing the government’s 2025 target of ¥31.2 billion within reach.
This analysis centers on fact-based data, organizing domestic and international demand structures and entry opportunities.
Key Takeaways
- Global matcha market reached $2.5 billion (¥390 billion) in 2024, growing 6-8% annually toward $3.5-4 billion by 2028, driven by North America, Europe, and Asia
- Japan dominates supply with 70% global market share, while export composition shifted dramatically—57% now powder tea (primarily matcha) versus traditional leaf tea
- Three-tier pricing structure emerged: volume tier (¥3,000-5,000/kg), mid-premium (¥6,000-9,000/kg), and ceremonial/single-origin (¥10,000+/kg) with 2-3x profit margins at top tier
- Regional consumption diverges: North America cafe-driven (80% channel share), Europe organic-premium focused (77% organic), Asia-Middle East RTD/dessert explosion (15% annual growth)
- Strategic opportunities span B2B bulk supply for chains, D2C premium subscriptions for affluent consumers, and functional derivatives for beauty/sports markets in emerging regions
\For Companies Seeking Matcha Powder/
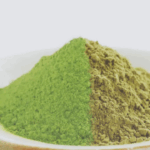
We source matcha from Japan’s premier production regions including Kyoto Uji, Kagoshima, Fukuoka, and Shizuoka, offering comprehensive grade ranges from organic JAS-certified ceremonial grade to processing-grade matcha.
Common Challenges:
- “We have projects but cannot secure stable matcha supply…”
- “We want to incorporate matcha into new café menu items!”
If you face these concerns, consult with Matcha Times. Feel free to contact us for initial inquiries.
What Is the Matcha Market Size?
Domestic Market Scale and Growth Trajectory
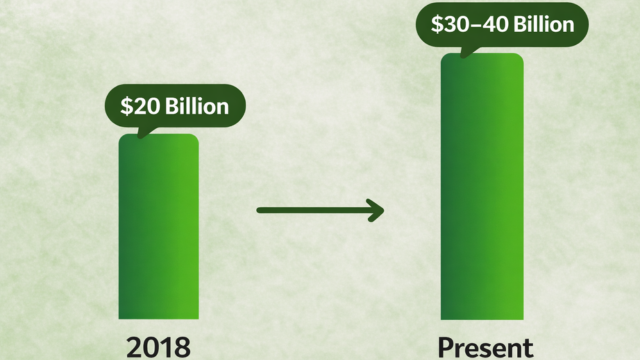
Japan’s domestic matcha market was estimated at approximately ¥20 billion in 2018 (Ministry of Agriculture, Forestry and Fisheries commissioned survey). Subsequently, the market continued growing due to matcha sweets and matcha latte popularity, plus inbound demand expansion, currently reaching an estimated ¥30-40 billion scale (industry estimates).
Recent years have seen diverse product development including cafe menu items using matcha, sweets, and processed foods, with support particularly from younger demographics and visiting tourists driving market growth.
Matcha’s Position Within Overall Tea Leaves
Matcha’s (powdered tea) presence in Japan’s tea market is expanding.
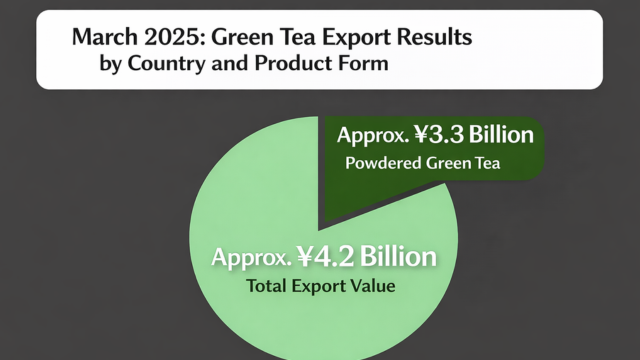
According to the latest March 2025 data, approximately 80% of Japanese tea (green tea) export value consists of powder form (primarily matcha) (Ministry of Finance Trade Statistics / Ministry of Agriculture, Forestry and Fisheries March 2025 data), continuing as the growth driver for Japanese tea exports.
Within the domestic market:
- Expanded matcha usage in Japanese cafe and sweets markets
- Increased demand for high-value, differentiated matcha ingredients (by production area / organic cultivation / by grade)
- Expanding applications in food and cosmetics industries
Matcha is evolving from mere beverage use into a multi-purpose material.
Global Market Scale and Growth Trajectory
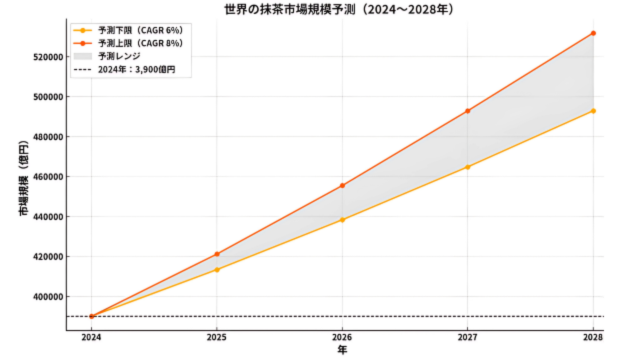
The global matcha market reached approximately $2.5 billion (approximately ¥390 billion) scale (2024 estimate).
Centered on North America, Europe, and Asia, it’s expanding at an average annual growth rate of 6-8%, projected to reach $3.5-4 billion scale by 2028.
Matcha Consumption Trends and Industry Structure Changes
Current State of Matcha Consumption in Domestic and International Markets
Viewing the current matcha consumption map, needs are clearly segmented between Japan and overseas.
Domestically, while traditional “tea ceremony use” and home whisked matcha are declining, processing and ready-to-drink/eat types like convenience store lattes, canned RTD (Ready-to-Drink) beverages, plus sweets and protein powders continue growing. Consumers prioritize convenience of “opening” and “dissolving” over “whisking”—matcha has entered daily life as an “ingredient.” This is Japan’s current market position.
Conversely, overseas shows different characteristics by region.
North America is cafe-driven centered on Starbucks. Matcha lattes and Frappuccino’s have become standard as coffee alternative caffeine sources, with food service bulk demand pushing the market upward.
Europe exhibits distinctive premium orientation valuing organic and ceremonial grades, with designated purchases occurring even above ¥10,000 per kg.
Asia and the Middle East, backed by hot-humid climates and demographic dividends, show double-digit growth in cold RTD beverages and dessert materials. Global consumption thus divides into three poles—”convenience (Japan/Asia),” “stimulation and trends (North America),” “authenticity and story (Europe)”—each pulling the market forward.
Supply Share and Procurement Volume
Viewing the global matcha supply chain, Japanese production still accounts for approximately 70% overall, followed by Chinese production at under 20%, with Taiwan and Korea sharing the remainder. Major North American and EU cafe chains and food manufacturers purchase approximately 1,500 tons annually, with 70-80% imported from Japan. On the Japan side, while tencha production hovers around 40,000 tons annually, export-bound portions have increased their ratio to approximately 40%, with export value reaching approximately ¥30 billion in 2023, continuing high growth in 2024. These numbers demonstrate that while demand steadily shifts overseas, the evaluation axis “high quality = Japanese production” remains strong.
Consumption Channels and Product Forms
Looking at consumption trends, “drinking matcha” leads the market, with cafes and restaurants holding 60% of global demand. In North America and ASEAN, lattes and frappuccinos at $4-6 per cup are routinely chosen, with unit prices remaining largely flat despite volume increases. Retail channels represent approximately 15% overall, though Europe shows notable designated purchases of organic and ceremonial grades, raising unit prices for household sticks and canned matcha. Processed foods like ice cream and confections also represent approximately 15% scale, but Southeast Asia and the Middle East continue exceeding 10% annual growth, with expanding conversion to protein and skincare materials. Finally, EC/D2C, while comprising approximately 10% volume share, commands unit prices 2-3x mass products. By combining “production area stories” and “regular subscriptions” with experiential value, this segment forms high-profitability pockets.
Industry Structure Changes

Value Chain Reorganization
Traditionally, “Japanese tea merchant → local subsidiary → cafe/retail” represented the standard finished product export route for Japanese matcha. Recently, however, players like wholesale specialist PanaTea handling 25 tons annually have begun vertically shortening supply chains by delivering directly to EC and restaurants.
Furthermore, major cafe chains are visible prioritizing stable supply by narrowing procurement sources while simultaneously introducing Chinese and Korean matcha as complementary risk diversification measures.
Channel-Specific Player Turnover
Cafe market: Beyond majors like Starbucks, “matcha specialty cafes” like MatchaBar are rapidly increasing on both coasts. Leveraging “authenticity orientation” and “SNS appeal” trending among local millennials, they’ve established a mid-price tier of $6-9 per cup.
Retail market: Organic supermarkets like Whole Foods are expanding private brand (PB) matcha products. By lowering prices for household accessibility, penetration among general consumers advances.
Specialty tea chains: High-priced tea chains face successive store closures due to demand plateaus and EC shifts—industry consolidation has begun.
Profit Structure Changes by Price Tier

This demand diversification transformed matcha’s profit structure into a three-tier model.
First Tier: ¥3,000-5,000/kg Volume Tier
The price tier where North American cafe chains and Asian RTD manufacturers purchase in volume—while volume is achievable, competition is intense and gross margins thin. Keys to making “high volume, low margin” viable include mechanizing shade cultivation and large-lot contracts through production area cooperation.
Second Tier: ¥6,000-9,000/kg Mid-Price Tier
“Premium business-use upper grades” differentiated by color, aroma, organic certification, etc. dominate, where both ingredient traders and brands can share profits. Particularly adopted by upscale cafes and ice cream chains in Europe and America, offering moderate volume with healthy margins.
Top Tier: ¥10,000+/kg Ceremonial/Single-Origin Tier
Distribution volume represents barely 5% of total, but because added value from stone-grinding and other labor-intensive methods can be sold with full stories, profit margins jump 2-3x. This tier matches well with D2C and experiential subscriptions, representing a blue ocean where both producers and brands can aim for “low-volume, high-profitability.”
Consequently, production areas face “volume and quality two-front operations“—both low-cost orientation for mass supply and brand development for premium small lots. To maximize profitability in matcha business requires determining which price tier to compete in, which channel receives strongest value proposition, and positioning within the three-tier model becomes decisive.
Market Scale and Growth Potential Changes
Market Scale and Growth Potential Transformation
Japan’s Export Trends
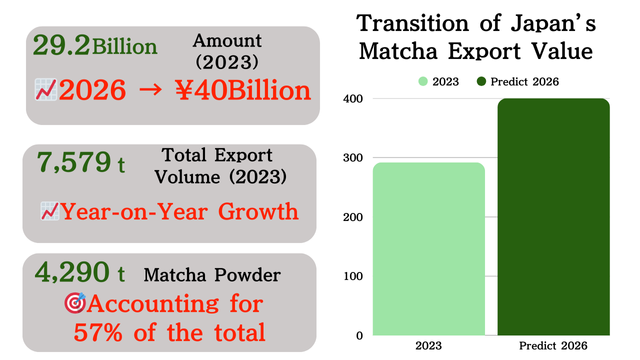
Export value: ¥29.2 billion (2023) → approximately ¥40 billion (2025)
Export volume: Of 7,579t total, powder tea (matcha, etc.) represents 4,290t (57%)
Primary destinations: USA 39%, Taiwan 23%, EU/UK 12% showing concentration
Four Factors Dramatically Changing Export Structure Over 2-3 Years
“Health & Wellness” Trend Acceleration—Powder Tea Needs Explode
- Post-COVID, North America and Europe re-evaluated matcha as a superfood providing complete catechins and theanine intake
- Riding the trend wave, beverage manufacturers and cafe chains adopted powder ingredients in volume, extending ingredient-based inquiries. This resulted in powder tea ratio rising to 57% of total export volume
Yen Depreciation and Government Export Drive Policies Expanding “Volume × Unit Price” Simultaneously
- Yen depreciation from 2022 onward (versus USD from 120s to around 150) effectively reduced Japanese tea procurement costs 15-20% for overseas buyers, serving as export volume push factor
- Simultaneously, MAFF and JETRO subsidized HACCP and organic certification acquisition for exports toward the “Agricultural, Forestry and Fishery Products/Foods ¥5 Trillion Export Goal.” Suppressing quality assurance costs made raising unit prices easier, making the step-up from ¥29.2 billion → approximately ¥40 billion (2025 target) realistic
Destination Concentration: North America Forms “Matcha Latte Economic Zone”
- USA centers on “matcha latte demand” led by Starbucks, Dunkin’, MatchaBar, etc., with business-use powder representing 80% of share
- Taiwan maintains share through both leaf and powder with thick consumer base enjoying Japanese tea leaves themselves due to longstanding tea culture and proximity logistics
- EU/UK steadily accumulate high-unit-price ceremonial/organic targeting leveraging EPA tariff elimination and organic JAS→EU Organic mutual recognition (though growth remains moderate due to high regulatory compliance costs)
Domestic Supply Chain Reorganization and “Tencha” Production Increase Results
- Shade cultivation area centered on major tea production areas Kagoshima and Kyoto increased +170% versus 2010. While overall tea farmers decline due to aging population, tencha production alone shows 7-8% annual growth trending through specialization conversion
- Producers stably supply the ¥3,000-5,000/kg zone through large-lot contracts, while Kyoto Uji and Aichi Nishio strengthen premium lines above ¥10,000/kg—”volume and quality polarization” shores up export competitiveness
Three Major Factors Supporting Global Demand Expansion

Wellness & Superfood Recognition
- Post-COVID market needs for “antioxidant/immune care” materials surged
- Matcha’s ability to provide complete catechin, theanine, and vitamin intake through whole leaf consumption evaluated as “all-in-one”
- National health and agricultural authorities actively promote functionality, with increasing academic data and functional food notifications
SNS Appeal (Photogenic Value)
- Vibrant “matcha green” serves as visual hook, rapidly expanding across image-based SNS (Instagram, etc.). Strategic hashtag usage like #matchalatte dramatically improved engagement through two-way communication by each brand
- Consumer surveys show “color” as most memorable packaging element at 60% = matcha green. US surveys also show ad recall top for “color” (60%), followed by antioxidant effects (48%)
Compatibility with Cafe Culture
- Cafes standardized as “third caffeine beverage”: After Starbucks introduced matcha latte in USA in 2006, it became permanent menu at $4-5
- Rise of specialty matcha cafes: MatchaBar and others at $6-9 mid-price tier provide “authenticity orientation + experiential” value, capturing health-conscious young upper-middle demographic
- Demographic avoiding coffee acidity/stomach burden seeks “gentle stimulation,” adopting matcha as coffee/energy drink alternative → Theanine’s relaxation effects provide more gradual, sustained caffeine impact versus coffee, matching matcha’s unique properties to trends
Regional Trends Across Major Overseas Areas
North America: Cafe-Driven Demand Explosion
As mentioned, after Starbucks made “Matcha Latte” permanent in 2006, matcha established itself in North America as “third caffeine beverage following coffee.” Gentler stimulation than drip coffee plus antioxidant image directly connected to post-COVID wellness orientation, with major chains alone procuring approximately 1,000t annually, 70-80% Japanese production.
Supply side leveraged shade cultivation production increases and yen depreciation advantages to stably supply business-use powder, while price-sensitive stores began using Chinese production at 30-40% Japanese production unit prices, intensifying competition. North America exhibits extreme “cafe concentration” structure with cafes representing 80% by channel, backed by North America’s unique consumption environment where per-drink ingredient costs remain low while appealing green color spreads easily via SNS.
Europe: High Unit Price + Organic Orientation
Europe maintains strong traditional black tea culture and sustainability consciousness, with Japan-EU EPA tariff elimination as tailwind actually reducing Japanese matcha import costs while maintaining unit prices exceeding North America at ¥10,000/kg level. Consumers value quality certification through ceremonial grade and production area labeling, with extreme organic concentration showing 77% of exports as organic JAS→EU Organic converted products. High disposable income demographics purchase “tea ceremony experiences” and “single origin” as complete stories, creating market expansion through value over volume in contrast to North America.
East Asia/Middle East: Growth Frontier
Asia and Middle East represent “next growth margin” areas.
Taiwan ranks second in export volume but 90% leaf tea, with ancient tea brewing culture and “Japanese production = high quality” brand deeply rooted, advancing designated purchases for household and gift uses.
Conversely, hot-climate markets Middle East and ASEAN show rapid growth in RTD matcha beverages and matcha dessert materials in bottles and pouches, with export volume continuing 15% annual average growth from fiscal 2020 (R2) through fiscal 2023 (R5). High youth population ratios, halal compliance ease, and reverse import effects from inbound tourism matcha experiences are driving new product development rushes among beverage and confectionery manufacturers.
Business Entry Opportunities and Strategies
B2B Ingredient Supply—Targeting “Volume” Demanded by North America Cafe Economy

Background of Increased North American Demand
In North America, cafes represent 80% of demand with over 1,000t business-use powder inquiries, so chains seek a three-point set: “stable lots,” “price,” and “certification.” As mentioned, Japan expanded large-lot supply capacity through shade cultivation production increases and yen depreciation, establishing ingredient business viability.
Approaches Bringing Entry Success Closer
- Production area cooperative “bulk purchase” scheme: For example, unite producers from Kagoshima, Kyoto, and Shizuoka tea-producing regions into one team, creating systems capable of receiving consolidated 100-ton annual orders for stable lot supply
- Dual standard products: Prepare ingredients simultaneously clearing US pesticide residue standards (FDA) and EU organic certification, enabling secure sourcing from chains in any country
- Port-proximity immediate delivery blend factory: Position blend & vacuum packaging lines near export ports (Nagoya Port, Kobe Port, etc.), receiving orders then performing custom blending at ¥3,000-5,000/kg price tier and directly loading for speedy delivery
D2C Premium—Direct Sales to Affluent Consumers “Buying Value”

Why D2C Remains Attractive Even at High Prices
In EU, matcha trades at approximately ¥6,000 per kg, higher than USA prices. Moreover, approximately 80% of imports are organic matcha.
EU customer segments pay for:
- Quality and production area stories (ceremonial grade, single origin, etc.)
- Environmental consideration (organic certification)
Making direct sales (D2C) sufficiently profitable.
Approaches Bringing Entry Success Closer
- Live commerce: Live-stream stone-grinding matcha while accepting EU-bound online orders on the spot
→ Secure repeats through monthly delivery subscriptions for 30g packs - Starter kit subscriptions: Initial shipment includes tea whisk (chasen) and tea bowl set, with subsequent deliveries providing different production area matcha each season through “experience + collectability” mechanisms for long-term continuation
- CO₂ emissions visualization: Display carbon dioxide amounts from production and transport processes on labels
→ Makes it easier for environmentally conscious affluent consumers to choose “this is safe”
Functional Derivatives—Asia/Middle East × Beauty/Sports Markets Advancing “Usage Diversification”

Why “Functional Derivative Model” Grew in Asia/Middle East
In Asia and Middle East, e-sports and extended study sessions are popular with many youth seeking “concentration enhancement,” and research data on L-theanine’s gentle caffeine effects spread via SNS, causing demand to explode.
Additionally, increased antioxidant action (EGCG) scientific papers drew attention to matcha as beauty and anti-aging keywords, spawning derivatives in skincare and protein fields, attracting attention in beauty powerhouse Korea.
Furthermore, in Middle East and Southeast Asian nations, halal certification represents mandatory product requirements. Matcha’s zero animal-derived ingredients make compliance easy, also presumed as a contributing factor.
Approaches Bringing Entry Success Closer
- Functional labeling & halal certification visualization: On product packaging, clearly show specific numbers like “◯mg EGCG, ◯mg L-theanine per serving” while simultaneously acquiring and printing halal certification marks. This alone conveys “clear efficacy, safe drinking in Islamic regions,” instantly expanding salable countries and customer segments
- Clean label formulation development: Keep formulation recipes utterly simple with “Matcha Only” formulations containing absolutely zero colorants, fragrances, or preservatives. OEM-supply this ingredient to local RTD (bottle) and ice cream manufacturers, co-campaigning as “additive-free matcha series” to simultaneously obtain mass production volume capacity and clean brand image
- Beauty influencer partnerships: Finally, tie up with influential beauty influencers across Korea, Thailand, UAE, and other countries. Provide clinical data from universities and labs showing “reduced skin oxidative stress by X%” in advance, having them post numbers and testimonials on SNS. Scientific backing paired with real word-of-mouth spreading together makes it easier to establish as “trusted items” rather than ending as fads
2025-2030 Scenarios and Risks
From here, we organize three possible growth scenarios the global matcha market may follow through 2025-2030, plus risk factors potentially shaking business continuity. We’ll overview baseline (stable growth), high growth (expansion acceleration), and risk (downside) cases, clarifying impacts on supply planning, investment decisions, and brand strategies.
Baseline Scenario (Most Likely Realistic Path)
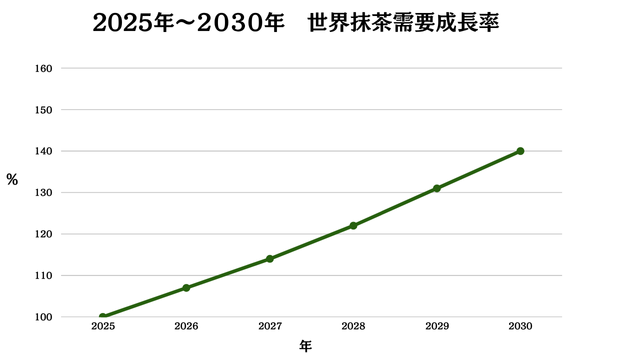
Through 2025-2030, global matcha demand gradually expands at 7% annual average, with North America and EU seeing complete establishment as “third caffeine beverage following coffee and energy drinks.” Growth remains steady but production cannot keep pace, with Japanese production ingredients chronically insufficient.
Consequently, procurement prices are expected to rise 3-5% annually. Trading companies and manufacturers handling ingredients face margin erosion risks without securing multiple production area backup contracts or long-term fixed-price agreements.
High Growth Scenario (Upside Case When Tailwinds Align)
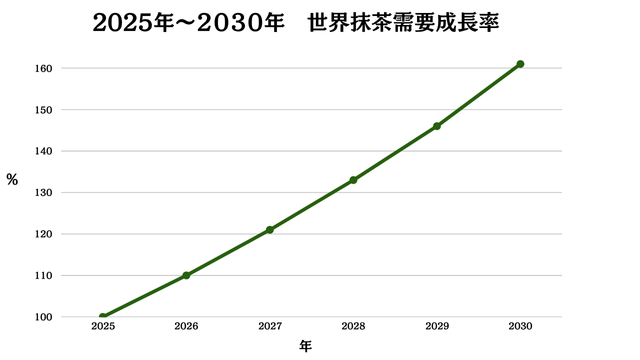
If bottled beverages (RTD) and beauty/nutrition field new matcha products become global hits, market annual average growth rates could exceed 10% in explosive expansion. Consumer eyes would turn toward “functionality, organic, single origin” high added-value, heating premium ingredient scrambles.
Premium ingredient international prices would jump while requiring rapid domestic tencha production system expansion to meet demand. Companies investing early in organic conversion and smart agriculture facilities would gain major advantages.
Risk Scenario (Downside/Warning Case)
If extreme heat or heavy rains from climate change plus aging farmers and labor shortages stagnate domestic production, ingredient supply becomes instantly unstable. Consequently, “low-priced but poor quality matcha substitutes” (synthetic colored powder and other-country blends) circulate in markets, risking consumer trust damage.
If the industry delays quality standards and traceability development, the brand advantage “matcha = Japanese production is best” could collapse. Companies must urgently diversify risks through overseas production area joint development and thorough quality certification system construction.
Check Matcha Industry’s Latest Information at “Matcha Times”!

We operate the specialized media [Matcha Times], where you can understand matcha’s “now” including matcha market trends and latest trends, notable domestic and international cases, tea garden interviews, and behind-the-scenes development stories.
✅ Those involved in matcha business
✅ Those considering new menu/new product development
✅ Those wanting to catch matcha industry movements
Please check [Matcha Times]!
Summary: Properly Understand Matcha Market’s Present and Future to Leverage in Business Planning
The matcha market continues expanding domestically and internationally. While competition intensifies, new opportunities spread through high quality, storytelling, and differentiation strategies.
Our company also provides OEM and food service supply centered on Uji matcha for restaurant, confectionery manufacturers, and overseas business operators.
Please feel free to contact us regarding business entry and product development consultations.